Infrared Remote Control Protocols: Part 1
As I was perusing the SB-Projects site on the different IR protocol formats, I decided to make a summary but later found out that it was a pretty standard thing, as documented by a Vishay document “Data Formats for IR Remote Control” (pdf).
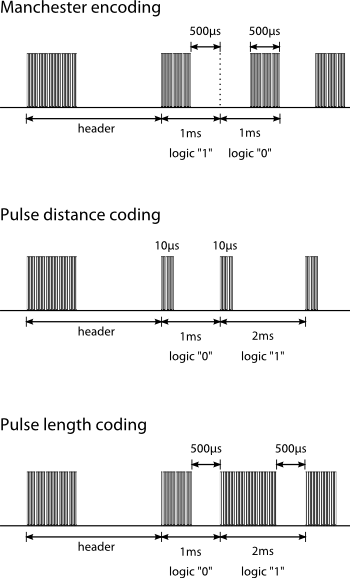
The infrared remote control signals are layered on top of a carrier signal of 36 or 38 kHz, therefore the signal can only be “on” or “off”. A transmission typically starts with an a burst (“on” state) that is used for the Automatic Gain Control (AGC) circuitry in the receiver, followed by the “off” state and the actual data transmission.
There are 3 basic types of data transmission formats, which are illustrated in the following diagram. Protocols can be based on these transmission formats, but need not necessarily conform to them.
So how do you know what your remote control uses? And how do you capture the sequence so that you can re-transmit it from an IR diode?
IR Signal Capture
To capture these infrared signals, we use an IR receiver module. This is typically a 3-pin device, which consists of an IR detector as well as built-in circuitry to demodulate the 36 - 38 kHz signal, producing a digital output corresponding to the transmitted data. If we had used an IR photodiode or phototransistor instead, we would have to demodulate the signal ourselves.
If you have a logic analyzer or an oscilloscope, you could simply hook up the IR receiver module and see its output on your screen. However, I do not have either of these, so I am going to rely on my trusty Arduino. For instructions on hooking up your IR receiver, refer to either the InfraredReceivers wiki page on Arduino Playground or ladyada’s IR tutorial. You should also verify the pinout of your receiver by reading its datasheet.
I started off with this sketch from the Arduino Playground, which uses pin #2 as its input. The sketch produces an output that you feed to gnuplot to get a waveform similar to what you see on an oscilloscope, so there’s a lot of additional data being output to make the waveform appear square.
We are only interested in capturing the duration for each “on” and “off” period in the signal, so I’ve made changes to the sketch to output only the durations, starting with the “on” duration of the header. The output, formatted into rows of 4, looks something like this:
Analyze IR Remote
Waiting...
Bit stream detected!
9156  4548   616   584
592   1692   616   1716
592   1716   588   584
592   1716   592   1692
616   1716   588   1696
616   1712   592   1716
592   564    612   584
592   584    592   584
592   1724   592   1716
592   584    588   1716
592   584    592   584
588   588    592   584
588   588    588   1720
588   588    588   588
588   588    588   1720
588   1716   592   1716
588   1720   588
Bit stream end!
This output was captured from an Apple Remote, whose format is well-documented. Looking at the Apple Remote page on Wikipedia, the IR signal protocol can be summarized by the following table:
| Signal Part | on (µs) | off (µs) |
|---|---|---|
| leader | 9000 | 4500 |
| 0 bit | 560 | 560 |
| 1 bit | 560 | 1690 |
| stop | 560 | - |
If you compare the first row of the output with the “leader” part of the signal, you can see that the values are quite close:
9156vs90004548vs4500
The reason why it’s not spot-on is that remote controls are low-cost devices. The oscillator that provides the signal timing is probably an on-chip RC oscillator, which is not a very accurate time source. Another possible reason could be lag in the IR receiver module. Therefore when designing an IR receiver, this must be taken into account. A 20 - 25% tolerance should be sufficient to accurately decode the signal.
What should you do if the protocol that you captured is not documented? Well, you should capture it a couple of times to get a good idea of what values are used, as well as acceptable. To illustrate this, I pressed the Play/Pause button on my Apple Remote about 100 times and counted the number of times each duration value was seen.
When you plot the histogram for all the durations, you should see a few clusters, representing the regions of interest. For the Apple remote, there will be 4 such regions, each of which will correspond to a value in the above table. These regions are shown in detail below:
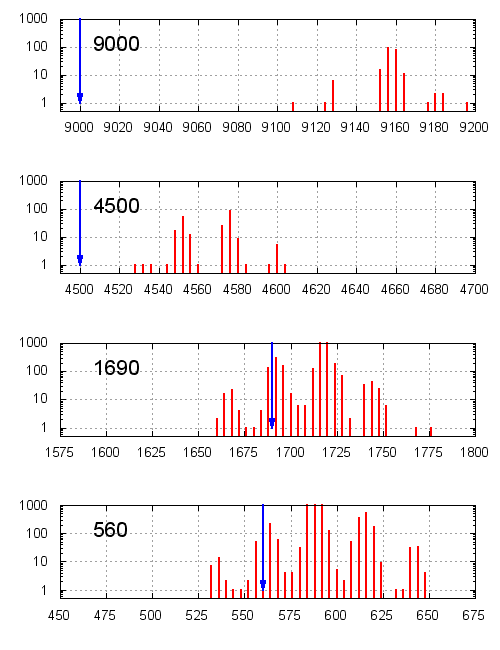
The blue arrows and the top left number indicate the documented pulse duration.
The 9000 and 4500 values appear less often because they only occur at the start of the IR signal, whereas the values 560 and 1690 are used to represent the data and therefore occur many times with each button press, depending on how many bits are transmitted.
If you have no idea what protocol this is, you could browse through the different IR protocols, looking for a match. However, if your aim is to simply to replay the IR signal, then you’re done - just choose suitable values to simplify your code. The IR protocol is unlikely to use many different durations, due to previously stated reasons. It is probably safe to take the middle of the seen values since any one of those are considered valid by the receiver.
An Improved IR Capture Sketch
The sketch has a hard-coded SAMPLE_SIZE of 64, which captures only 64 values. Contrary to what you might think, increasing SAMPLE_SIZE does not automatically allow you to capture more values. For signals that have less than SAMPLE_SIZE transitions, the sketch will wait indefinitely to fill all SAMPLE_SIZE values. You could workaround this problem by pressing the remote twice, but that would be an inelegant solution.
Instead, I’ve rewritten the sketch to timeout when a transition is not detected after some time (i.e. when TIMER1 overflows). IR signals do not have long durations for practical reasons - you wouldn’t want to have to aim your remote at the TV for 2 to 3 seconds. I have also cleaned up the code considerably.
My version of the sketch is below:
/*
 * IRanalyzer.pde
 * based on http://arduino.cc/playground/Code/InfraredReceivers
 *
 * modified by Darell Tan
 * see http://irq5.io/2012/07/27/infrared-remote-control-protocols-part-1/
 */

#include <avr/interrupt.h>
#include <avr/io.h>

#define READ_IR        ((PIND & _BV(2)) >> 2)  // IR pin
#define TIMER_RESET    TCNT1 = 0
#define TIMER_OVF      (TIFR1 & _BV(TOV1))
#define TIMER_CLR_OVF  TIFR1 |= _BV(TOV1)
#define SAMPLE_SIZE    128

unsigned int TimerValue[SAMPLE_SIZE];

void setup() {
  Serial.begin(115200);
  Serial.println("Analyze IR Remote");
  TCCR1A = 0x00;
  TCCR1B = 0x03;
  TIMSK1 = 0x00;

  pinMode(2, INPUT);  // IR pin here
}

void loop() {
  int i;

  // reset
  for (i = 0; i < SAMPLE_SIZE; i++)
	TimerValue[i] = 0;

  Serial.println("Waiting...");
  while(READ_IR == HIGH);

  // reset timer, clear overflow flag
  TIMER_RESET;
  TIMER_CLR_OVF;

  // first value
  i = 0;
  TimerValue[i++] = 0;

  char prev_dir = 0;
  while (i < SAMPLE_SIZE) {
	while (READ_IR == prev_dir) {
	  // if the pin has not changed, check for overflow
	  if (TIMER_OVF)
		break;
	}
	TimerValue[i++] = TCNT1;
	prev_dir = !prev_dir;
  }

  Serial.println("Bit stream detected!");
  for (i = 1; i < SAMPLE_SIZE; i++) {
	long time = (long) (TimerValue[i] - TimerValue[i-1]) * 4;
	if (time == 0 || TimerValue[i] == 0)
	  break;

	Serial.print(time);
	Serial.print("\t");

	// newline every 4 values
	if ((i % 4) == 0)
	  Serial.print("\n");
  }
  Serial.println("\nBit stream end!");
}
IR Capture using the iMON
I received a SoundGraph iMON device some time back and I thought that I could put it to good use here, so I downloaded LIRC 0.9.0 and compiled it. You will need to compile two kernel modules as well: lirc_dev and lirc_imon. When loaded into the kernel, the /dev/lirc0 device will be created (I only have one IR device).
I used the mode2 utility that came with LIRC to print out the “raw data” received by the iMON, much like what the Arduino sketch does. By specifying the -m flag, values are displayed in a “wide” format.
[darell@localhost lirc-0.9.0]$ tools/mode2 -d /dev/lirc0 -m
	 9250     4250      750      500      500     1750
	  500     1750      500    11750      500      500
	  750     1500      750     1500      750     1500
	  750     1500      750     1500      750     1500
	  750      500      750      500      500      500
	  750      500      500     1750      750     1500
	  750      500      500     1750      500      500
	  750      500      500      500      750      500
	  750      500      500     1750      500      500
	  750      500      750      250      750     1750
	  500     1750      500     1750      500     1750
	  500    30250
One thing you might have noticed is, why are the numbers so “round”? If you take the greatest common divisor of 9250, 4250, 750 and 500, you will have your answer: 250. All of these numbers have been rounded to 250 µs, which is not terribly accurate.
Also, if you capture the same input signal several times, here’s what you will see (each capture is laid out vertically):
9000    9000    9000    9000    9000
4500    14500   4500    14250   4500
750     500     500     750     500
500     500     750     500     500
500     750     500     750     750
1750    1750    1750    1500    1500
500     500     500     750     750
1750    1750    1750    1500    1500
500     500     500     750     750
11750   1750    1750    1500    11500
500     500     500     750     750
How did 4500 µs turn into 14500 µs, and how did 1500 µs become 11500 µs? The values went from 1 ms to 10 ms - the error is quite large and it happens often.
The iMON or its LIRC drivers (whichever it is) is simply unreliable and offers very poor resolution. Sadly, I think this device will have to be scheduled for “organ harvesting” soon.
Protocol Format
Since this protocol has been documented, understanding it will be much easier. The protocol starts off with two values for the header: 9000 and 4500. Following that, it is just a stream of a pair of (560, 560) to represent a “0” or a pair of (560, 1690) to represent a “1”. This protocol uses the “pulse distance coding”, where the pulses are of the same length (560 µs) but the distance between this pulse and the next decides whether the data bit is a “1” or “0”.
Let’s start by decoding the captured values:
9156  4548   616   584    |  header, "0"
592   1692   616   1716   |  "1", "1"
592   1716   588   584    |  "1", "0"
592   1716   592   1692   |  "1", "1"
616   1716   588   1696   |  "1", "1"
616   1712   592   1716   |  "1", "1"
...
588   1716   592   1716   |  "1", "1"
588   1720   588          |  "1", STOP
Note what the wiki states about the protocol format:
The first two bytes sent are the Apple custom code ID (0xEE followed by 0x87), which are followed by … making a total of 32 bits of data. All bytes are sent least significant bit first.
The first 8 decoded bits are 0111 0111 but since the LSB is sent first, the bits should read 1110 1110 instead, which is 0xEE in hexadecimal. The subsequent decoded byte should therefore be 0x87.
There will be a total of 32 bits and it ends with a single 560 µs pulse.
What’s Next?
In the next post, a case study of an unknown remote control protocol will be presented, as well as how we can use this information to make our own remote control that emulates the protocol.