Testing the Shinyei PPD42NS
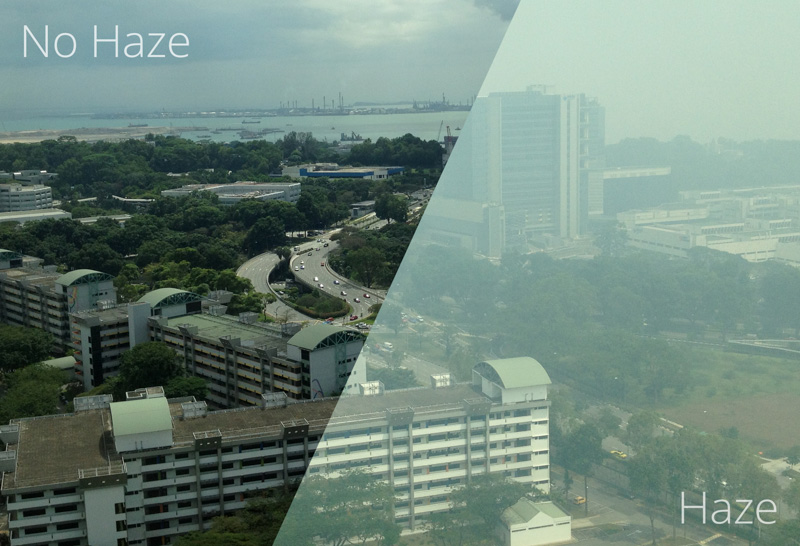
Around this time last month, the haze (or what some people call smog) here set a record high level for the Pollutant Standards Index (PSI). This is what it looked like outside:
As our National Environment Agency only published 3 hour PSI averages, I thought it would be good if we could get our own measurements. The PSI used here is somewhat like the Air Quality Index (AQI) used in the US, and is made up of 5 components:
- PM10 particulate matter
- sulphur dioxide (SO2)
- carbon monoxide (CO)
- nitrogen dioxide (NO2)
- ozone
Note that the AQI includes PM2.5 particulate matter whereas PSI does not. From what we can see, I would think that a major contributor to the PSI is particulate matter (PM).
I took a brief look at the projects such as the Air Quality Egg and PACMAN. They used either the Sharp GP2Y1010AU0F or the Shinyei PPD42NS. These sensors generally operate based on the light-scattering principle, by measuring the amount of light that is scattered by particles.
The PPD42NS
Chris Nafis has done a great job documenting the use of both the GP2Y1010AU0F and the PPD42NS, compared against a Dylos DC1100 air quality monitor. As the GP2Y1010AU0F requires a certain pulse waveform to be supplied to its LED pin, I would say that the PPD42NS is self-contained and thus much easier to hook up.
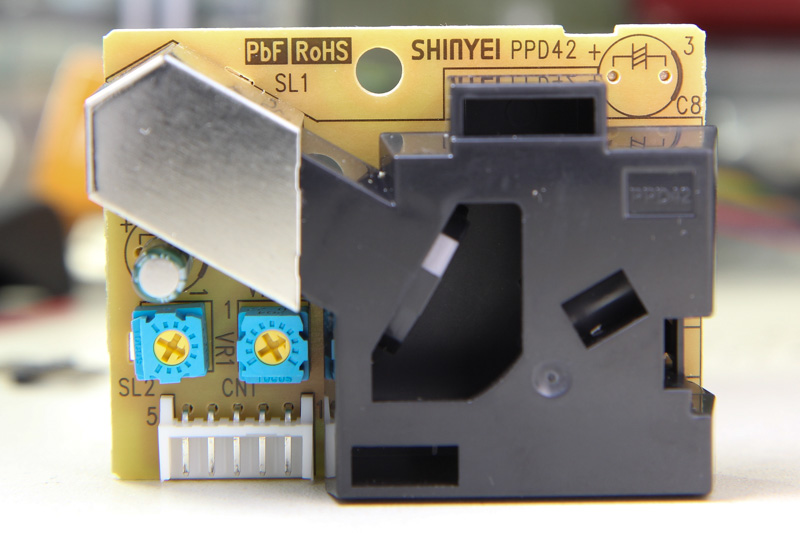
On the front, it has 2 pots labelled VR1 and VR3 that have been already factory-calibrated. The IR detector is covered under the metal can. Interestingly there’s a slot by the side labelled SL2 which is unused. If you’d like to see what’s under the hood, Chris opened up the black casing and posted a photo here.
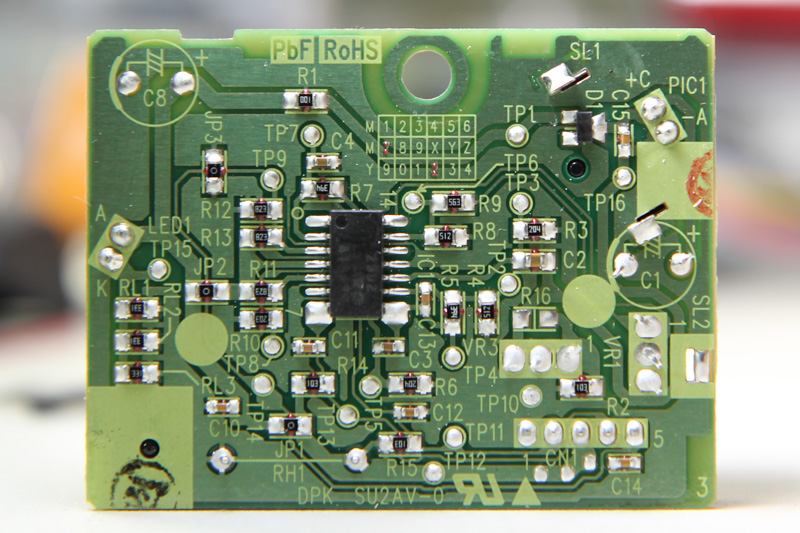
Looking at the date code grid on the PCB, the units look like they were manufactured in July 2012. The circuit consists largely of passives and an op-amp. RH1 is the resistor heater which, in theory, could be removed to save power if there was some other method of air circulation.
Sensor Placement
There are several points that should be observed when deciding how the sensor is placed.
- The sensor must be placed in a vertical orientation. This is easy to understand as the heater is located below. Any other orientation would not achieve the desired airflow expected by the designers.
- The sensor should be kept in a “complete [sic] dark condition”. I believe the unit is smart enough to not be affected by normal lighting as it uses infrared, but I guess it is still a good measure.
- “Also soft cushioning material to seal the gap between sensor and housing is necessary.”
- Sensor should be located away “from any winds or air stream effected by air purifier”.
I’m not sure if leaving the sensor “window” exposed will affect the readings by a lot but David Holstius did cover it with some stiff paper.
Sensor Output
The sensor output is normally high, but goes low in proportion to the PM concentration, hence by measuring what they call Lo Pulse Occupancy (LPO), the PM concentration can be determined.
This LPO is recommended to be measured over a unit time of 30 seconds, but I opted to record at 15-second intervals instead to get a higher resolution. To get the LPO time for a 30-second time period, we just need to average the two 15-second values - simple math.
As I do not need the exact calibrated figures, there was no need to fit the values to the equation derived by Chris (yet). With the raw values recorded, I can always do this at a later time.
Note that the sensor readings are very noisy. Here are the plots over 24 hours, without averaging and with a 50 value rolling average (12.5 minutes):
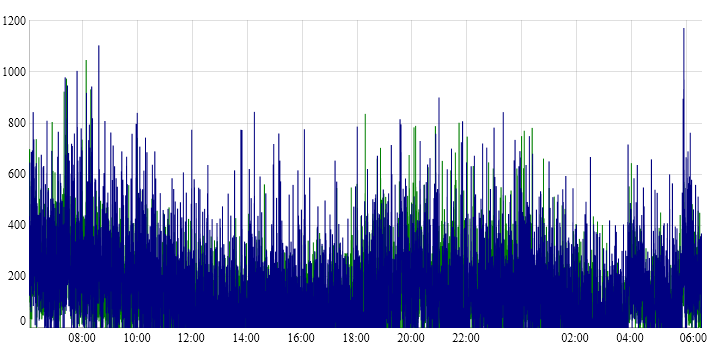
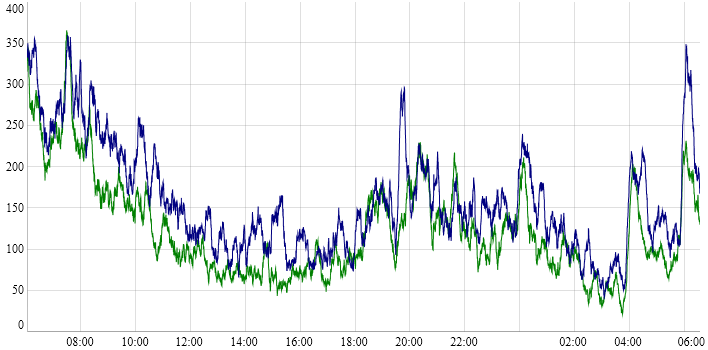
It is definitely easier to read the graphs with averaging enabled. Subsequent graphs that appear in this post have a 15 value rolling average applied.
Test Setup
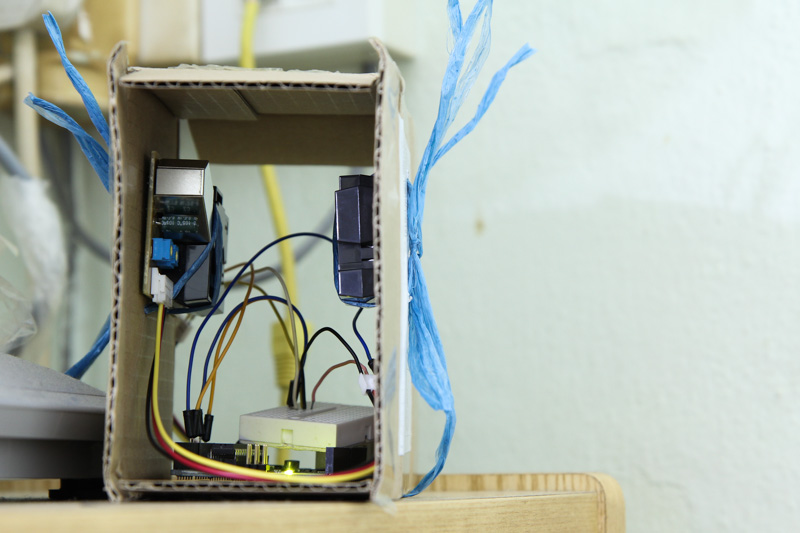
Using the same parcel that the sensors were delivered in, I punched a couple of holes on both sides, made sure they lined up and tied 2 sensors on either side using raffia string.
Both sensors were hooked up to an Arduino that measured the LPO time of each sensor and output them via serial. The Arduino was connected via USB to my Linux server which runs a simple Python script that timestamps and logs the values.
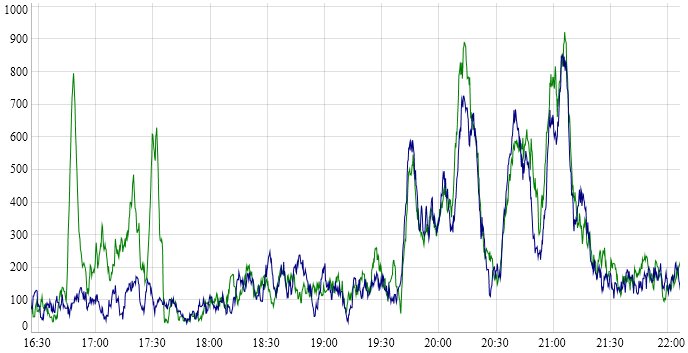
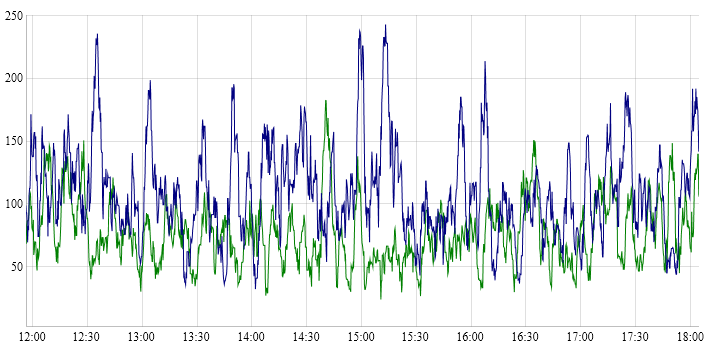
One of the sensors would produce a higher and sometimes spurious output occasionally and I couldn’t figure out why. However it would agree with the other sensor most of the time. This is also why I usually buy at least 2 sensors to make sure their readings are similar.
Notice the spike from one sensor occurring around 17:00 to 17:30:
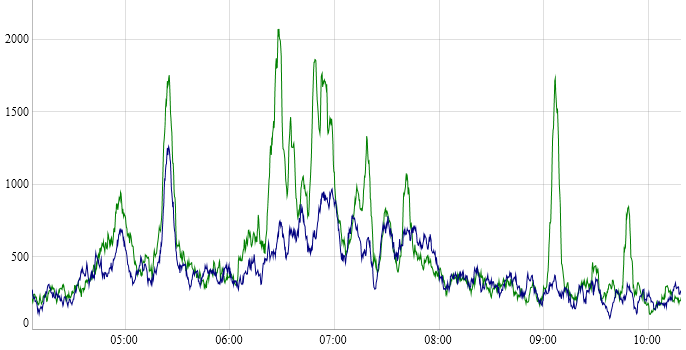
Notice 2 spikes from only one sensor between 09:00 and 10:00, and the region from 06:00 to 08:00 shows a significantly higher reading:
Subsequently, I took the sensors out, used a blower to remove any dust in the assembly, replaced the raffia string with twist ties and hooked them up again. I also closed the front of the box, leaving just a small slit for the air to flow through. The problem went away and I didn’t manage to figure out what was the cause.
Anyway, here’s what my ambient indoor readings (when nobody is home) look like:
The sensor is sensitive enough to pick up cigarette smoke. When nobody is at home and the doors and windows are closed, the PM concentration gradually goes down.
What’s Next?
Now that I’ve been measuring the level of particulate matter indoors, I will need to build a proper enclosure for outdoor use. I have an enclosure that looks very similar to this one that David Holstius used, but I plan to use a slightly bigger one so that I can house the electronics inside as well.
As I opted to ship the sensors by registered mail (it’s the cheapest method), it took about 3 weeks to arrive. By the time I received the sensors, the PSI had dropped back to normal or “safe” levels, which is no doubt a good thing. At least now I can start collecting data to get a baseline for “clean” air.